How much inventory is on the market in Austin right now?
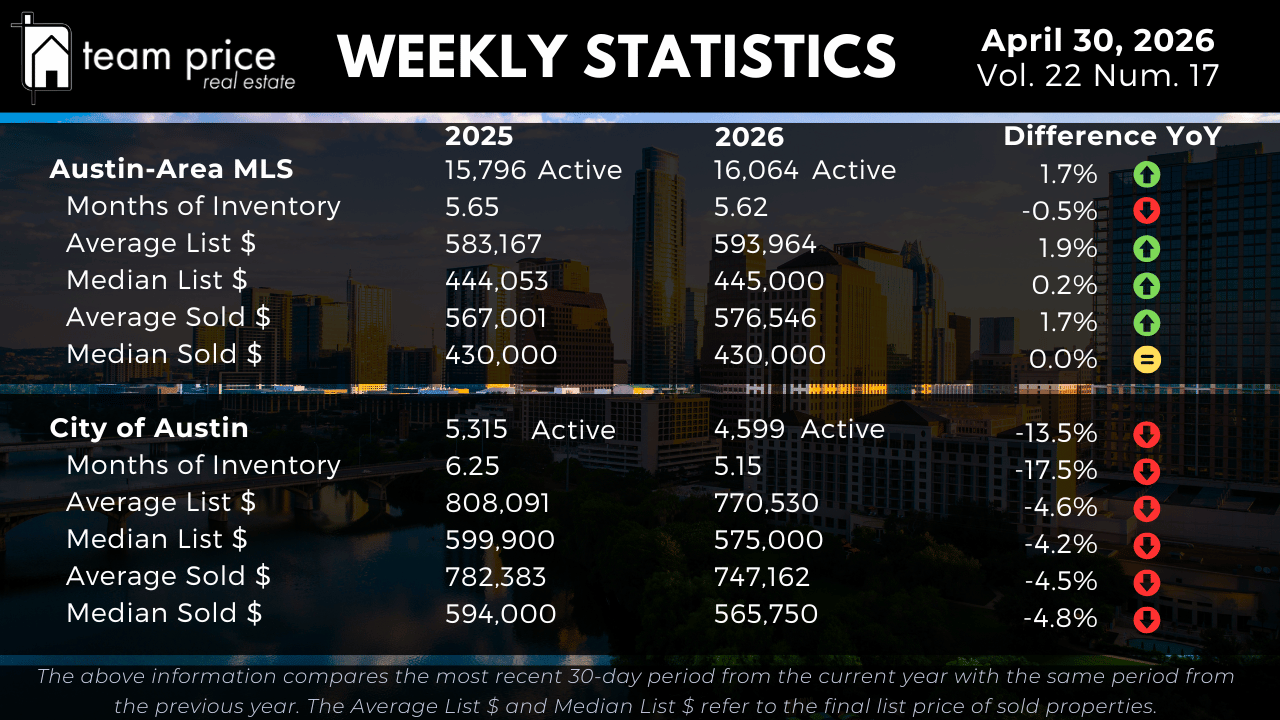
Active inventory in the Austin-Area MLS is at 16,064 listings, up 1.7 percent from 15,796 a year ago. That is essentially flat at the regional level. The City of Austin, however, has tightened sharply, with active listings down 13.5 percent year over year, falling from 5,315 to 4,599. Months of inventory across the broader MLS holds at 5.62, almost identical to last year's 5.65. Inside the city, months of inventory has dropped from 6.25 to 5.15, a decrease of 17.5 percent. That divergence matters. The regional MLS is carrying roughly the same supply it did last spring, while Austin proper is absorbing inventory measurably faster than the surrounding metro. For buyers focused on the urban core, the cushion of choice has thinned. For buyers willing to look outward into Williamson, Hays, Bastrop, and the broader Austin-Area MLS footprint, selection remains close to a year ago.
What are home prices doing in the Austin-Area MLS this week?
The Austin-Area MLS median sold price is $430,000, unchanged year over year. The average sold price is $576,546, up 1.7 percent from $567,001 last April. On the listing side, the average active list price is $593,964, up 1.9 percent year over year, and the median active list price is $445,000, up 0.2 percent. The pattern is consistent. Sellers are pricing modestly higher on the front end, but what is actually closing has held flat at the median. That gap between aspirational list pricing and final sold pricing is what continues to create negotiation room for prepared buyers across the broader region.
What is happening to home prices in the City of Austin?
The City of Austin median sold price is $565,750, down 4.8 percent year over year from $594,000. The average sold price inside the city is $747,162, down 4.5 percent from $782,383 a year ago. Active list pricing has come in as well, with the average active list price at $770,530 (down 4.6 percent) and the median active list price at $575,000 (down 4.2 percent). The City of Austin continues to recalibrate more visibly than the broader MLS. This is not a market in distress. It is a market where sellers and buyers are meeting at lower closing prices than they were last spring, and where tightening inventory and falling prices are creating a window for buyers who have been waiting for both selection and value to align.
How much room do buyers have to negotiate in Austin right now?
The average sold-to-list price ratio across the Austin-Area MLS is 97.67 percent. So far this month, 61.94 percent of sold properties closed below list price, down from 65.14 percent last month. Another 22.72 percent sold at list price, and 15.34 percent sold above asking. That above-list figure is up from 13.13 percent last month, though it is essentially even with last April's 15.37 percent. Read together, the data shows two markets running in parallel. The majority of sellers are still negotiating below their list price, but a meaningful and growing share of well-prepared, well-priced listings are pulling in offers at or above asking. Pricing strategy at the listing stage is doing more of the work than it has at any point this year.
Which Austin cities and ZIP codes are gaining ground?
Submarket performance is split almost down the middle. Of the 30 cities tracked across Central Texas, 15 posted a month-over-month price increase and 15 posted a decrease. Year over year, only 9 of 30 cities are showing a price increase, while 21 are showing a decrease. Across the 75 ZIP codes tracked, 33 gained ground month over month, 40 lost ground, and 2 held flat. Year over year, 30 ZIP codes are up and 45 are down. None of the 30 cities or 75 ZIP codes are above their 12-month price peak. The takeaway for buyers and sellers is straightforward. The Austin headline numbers describe an average that very few neighborhoods actually match. Local price action is what determines the right offer, the right list price, and the right timing, and that requires hyperlocal data, not metro averages.
How far are Austin home prices below their peak?
Across the Austin-Area MLS, the median sold price is $430,000, down $108,000 or 20.1 percent from its May 2022 peak of $538,000. The average sold price is $575,205, down 13.4 percent from its May 2022 peak. Median sold price per square foot sits at $214, down 23.6 percent from its April 2022 peak of $280. Inside the City of Austin, the median sold price of $565,750 is down $114,250 or 16.8 percent from the May 2022 peak of $680,000. The average sold price is down 11.3 percent from peak. Median sold price per square foot is down 22.9 percent. Peak-to-current numbers continue to define the affordability conversation in Central Texas. The drop from the 2022 highs is real and durable, and it is the foundation of the buying opportunity that exists right now in both the broader MLS and the urban core.
What is the outlook for the Austin housing market heading into May?
Late April delivered a market that is stable at the regional level and tightening inside the city. The Austin-Area MLS median sold price has held the $430,000 line year over year. The City of Austin has lost 13.5 percent of its active inventory in the past twelve months while pricing has continued to soften. That combination, falling supply paired with adjusting prices, often precedes the point where price declines slow or stop. We are not calling that turn yet, because the data does not yet support it. What the data does support is a market entering May with more clarity than it has had in months. Buyers have a working price floor at the regional median, real negotiation room, and meaningful selection. Sellers who price to the current market, not to last year's comps, are still transacting. Both sides have something to work with.